Detection connects delivery metrics (DORA) to code health dimensions — architecture, complexity, maintainability, and test effectiveness — to reveal why your engineering is slow, not just that it's slow. It surfaces root causes that symptom-level dashboards miss, including AI readiness gaps that determine whether AI agents will help or hurt.
Your lead time is 18.7 days. You know this because you have a dashboard.
But why is it 18.7 days? Your pipeline takes 47 minutes. Code reviews complete in a day. So where are the other 17 days going?
This is the gap that Detection closes.
The Dashboard Problem
Most engineering organizations have invested in metrics. They track DORA. They measure coverage. They have Jira velocity charts and deployment frequency graphs. But when someone asks "Why is delivery slow?" — the data doesn't have an answer.
A team sees high change failure rate and responds with more manual QA. But the real cause is architecture violations that force every change to touch seven modules. More QA doesn't fix that — it just makes slow delivery slower.
Another team sees long lead times and blames code review bottlenecks. But the real cause is high complexity that makes changes large and risky, which makes reviews take longer. Hiring more reviewers doesn't fix that either.
The symptoms are visible. The causes are buried in the code.
From Symptoms to Causes
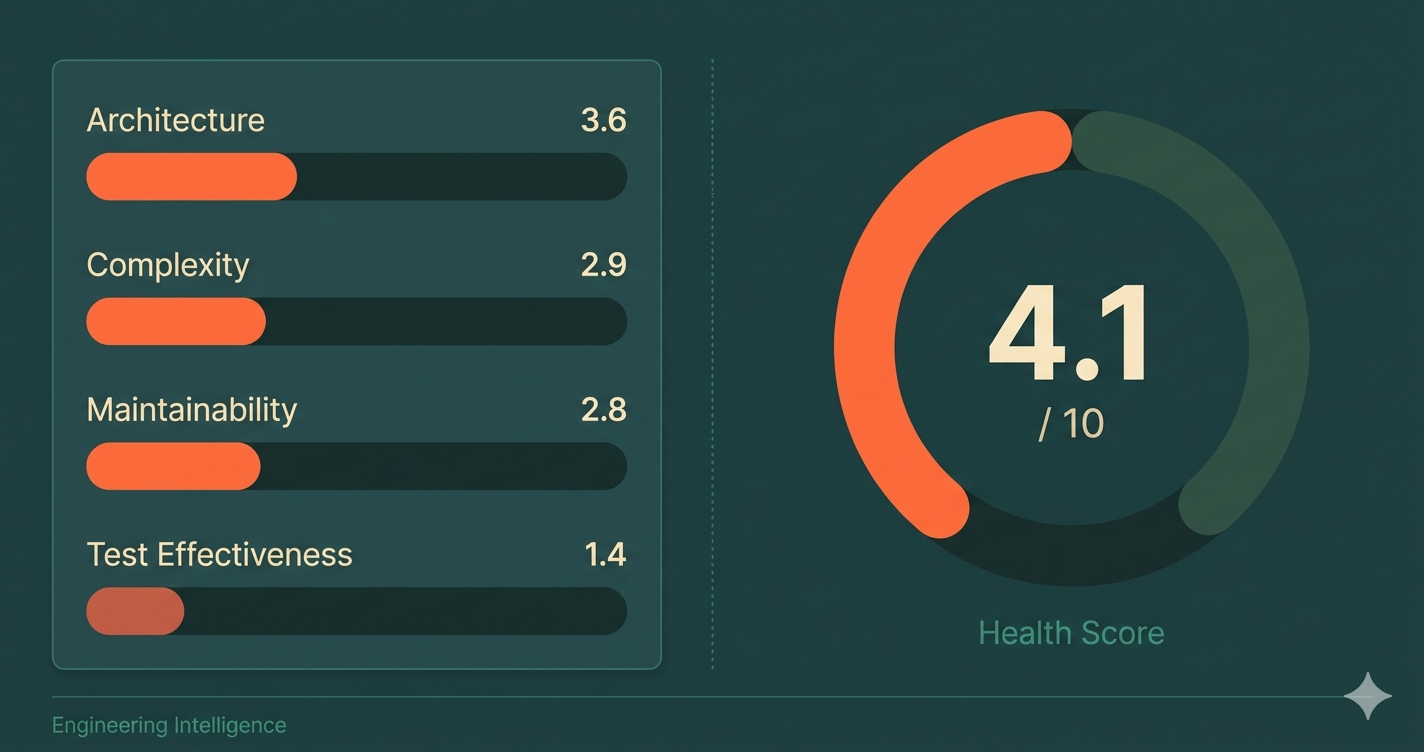
Detection takes the symptoms you already see (DORA metrics, delivery speed, failure rates) and correlates them with four dimensions of code health — rules rooted in XP and Continuous Delivery principles — that reveal the underlying causes.
Dimension 1: Architecture
Your architecture score measures whether code is organized so that changes can be small and isolated. It checks specific structural rules: Are dependencies pointing inward (domain has zero external dependencies)? Is I/O pushed to boundaries (business logic doesn't perform direct database, HTTP, or file system calls)? Are module contracts explicit (no wildcard exports leaking internals)? Are aggregates referencing each other by ID, not object reference?
A codebase with 3,730 architecture violations — circular dependencies, framework code leaking into domain, cross-aggregate references — doesn't just have "tech debt." It has a structural reason why lead time is 18 days instead of 2. Every change requires navigating tangled dependencies, and every tangled dependency increases the blast radius of every commit.
When architecture score is low, changes can't be small. When changes can't be small, reviews take longer. When reviews take longer, lead time inflates. The DORA dashboard shows "18.7 days." The architecture score shows why.
Dimension 2: Complexity
Your complexity score measures how much mental effort each change requires. It goes beyond simple line counts to detect compound problems: god classes (300+ lines, 15+ methods, 10+ fields all tangled together), brain methods (long AND complex AND variable-heavy), deep nesting that compounds cognitive load, and change-pattern smells like shotgun surgery — where a single change forces edits across many unrelated files.
Cyclomatic complexity determines your minimum test burden: a function with complexity 15 needs at least 15 test cases to cover its paths. Most functions with complexity above 10 don't have even half that coverage.
Complexity is also the strongest predictor of change failure rate. Modules with complexity scores below 3.0 account for a disproportionate share of production incidents — not because developers are careless, but because the code makes it nearly impossible to predict the consequences of a change.
Dimension 3: Maintainability
Your maintainability score measures how expensive your codebase is to work in day-to-day. It covers naming quality (do names reveal intent, or do you need to read the implementation to understand what something does?), function clarity (command-query separation, guard clauses over nested conditionals, one abstraction level per function), and code hygiene (dead code, commented-out code, magic numbers, speculative generality).
Studies consistently show that developers spend 58-70% of their time reading and understanding code, not writing it. A low maintainability score means that percentage is on the high end. Your team isn't slow because they lack skill — they're slow because the codebase is expensive to read.
Maintainability also determines whether improvements stick. Refactor a module surrounded by poor naming, high duplication, and inconsistent patterns, and the entropy returns within weeks — the surrounding code pulls new code toward the same habits.
Dimension 4: Test Effectiveness
Test effectiveness is the dimension with the most depth — and the most common misconceptions. It is not just mutation score or line coverage. It measures whether your tests are designed to catch real problems.
The assessment checks test structure: Does each test verify one logical behavior (not five assertions testing unrelated things)? Do test names read like specifications? Is there clear Arrange-Act-Assert separation, or is test logic tangled with conditionals and loops?
It checks test design philosophy: Are tests using real domain objects (sociable testing) or mocking everything into meaninglessness? Are they verifying observable state changes, or just checking that internal methods were called? Are test data builders in use, or is every test constructing objects from raw literals?
It checks test boundaries: Are only I/O boundaries stubbed (databases, HTTP, file systems), or is the team mocking domain collaborators too — effectively testing their mocks instead of their code?
And yes, it checks mutation score — because even well-structured tests can miss actual defects. But mutation score without good test design is just a number to game. The combination is what matters.
From Four Dimensions to One Score
These four dimensions combine into a single health score on a 0-10 scale. But the score alone isn't the point — the correlation between the score and your delivery metrics is.
Consider two services in the same organization:
| Metric | Payment Service | User Service |
|---|---|---|
| Health Score | 6.4 / 10 | 2.1 / 10 |
| Lead Time | 3.2 days | 16.1 days |
| Change Failure Rate | 8% | 41% |
| Deployment Frequency | On demand | Bi-weekly |
| Test Effectiveness | 72% | 11% |
Same team. Same tools. Same processes. Completely different results. The difference is the code underneath.
The DORA dashboard shows two services performing differently. Detection shows why — and what to fix first.
Tech Debt Is Not a Feeling
Every engineering leader has had the "tech debt" conversation. The one where the team says "We need to pay down tech debt" and leadership asks "How much? Where? What's the ROI?"
The conversation stalls because tech debt is a feeling. It's there, but there's no number attached to it.
Debt density changes that. By scoring violations across all four dimensions and normalizing per 1,000 lines of code, you get a number that's:
- Comparable — across services, teams, and time periods
- Trackable — is it going up or down each quarter?
- Actionable — which category drives the most debt?
- Board-ready — "Debt density is 48.2 and degrading 8% per quarter" is a sentence leadership can act on
When tech debt has a number, it gets a budget. When it's a feeling, it gets deferred.
AI Readiness: Is Your Codebase Ready for Agents?
Beyond the four health dimensions, Detection produces a separate AI readiness score. It starts with a weighted reading of your health across all four dimensions, then layers in codebase signals that specifically affect how AI agents behave.
Those signals include: Is the codebase statically typed? Type annotations give agents guardrails that untyped code doesn't. Is there domain-oriented structure — distinct modules that help an agent understand which code belongs together? Are interfaces and contracts explicit, or are boundaries implicit? And critically: are tests present at all? A codebase without tests loses significant ground, because tests are an agent's primary feedback loop.
A codebase can score 6/10 on general health and still score low on AI readiness — because the implicit knowledge, hidden coupling, and untyped boundaries that humans navigate by memory are invisible walls for an agent.
The more useful question isn't "Which AI tool should we buy?" — it's "Is our codebase ready for what AI will do to it?"
What to Fix First: Prioritized Actions
A diagnosis is only useful if it leads to action. Detection doesn't just score — it prioritizes.
Based on the correlation between code health dimensions and delivery metrics, it surfaces the fixes with the highest impact:
Priority 1: Break circular dependencies (156 found) → projected -30% lead time impact
Priority 2: Improve mutation score from 12% to 60% on critical paths → projected -50% change failure rate
Priority 3: Establish contract tests across 4 services → projected -40% cross-service failures
Each priority is ranked by its projected impact on DORA metrics — not by how "bad" the code looks, but by what's actually slowing delivery.
This is the difference between "We need to fix tech debt" (a feeling) and "Breaking these 156 circular dependencies will reduce lead time by 30%" (a plan with projected ROI).
The Closed Loop
Diagnosis without verification is guesswork. Detection isn't a one-time report — it's a continuous feedback loop.
- Diagnose — Connect your repo. Get your health score, DORA metrics, and AI readiness assessment.
- Prioritize — See which fixes will move delivery metrics most.
- Fix — Address priorities through guided remediation (characterisation tests first, then TDD refactoring cycles).
- Verify — Detection re-runs after every push. Watch the score move. See the DORA correlation shift.
The loop closes when every fix has measurable proof. Not "we refactored the payment module" but "payment module health went from 3.2 to 6.8, lead time dropped from 12 days to 4, change failure rate from 38% to 11%."
The Bottom Line
Slow delivery, high failure rates, tech debt that's felt but not measured. Dashboards show the symptoms. Detection shows the cause.
Four dimensions. One health score. Correlated to the delivery metrics that matter.
The question isn't "Are we slow?" — you already know the answer. The question is "Why are we slow, and what do we fix first?"
That's what Detection reveals.

