DORA metrics are four key indicators — Deployment Frequency, Lead Time for Changes, Change Failure Rate, and Mean Time to Restore — that measure software delivery performance. They become vanity metrics only when teams observe them without connecting them to the code-level causes that drive the numbers. Elite teams use DORA as a compass by linking delivery outcomes to code health dimensions.
Your team tracks DORA. You have the dashboard. Every quarter, someone presents the numbers — lead time is 14 days, deployment frequency is biweekly, change failure rate is 23%.
Everyone nods. Nothing changes.
This is DORA as vanity metric. And it's how most engineering organizations use the most important measurement framework in software delivery.
What Are DORA Metrics?
DORA metrics are four key indicators that measure software delivery performance: Deployment Frequency, Lead Time for Changes, Change Failure Rate, and Mean Time to Restore. Developed by the DevOps Research and Assessment team (now part of Google Cloud), they classify teams as Elite, High, Medium, or Low performers based on delivery speed and stability.
The research behind DORA — spanning over a decade of Accelerate State of DevOps Reports — consistently shows that elite performers deliver faster and more reliably. Speed and stability are not tradeoffs. They are correlated outcomes of the same engineering practices.
| Metric | Elite | High | Medium | Low |
|---|---|---|---|---|
| Deployment Frequency | On demand (multiple/day) | Weekly to monthly | Monthly to semi-annually | Less than once per six months |
| Lead Time for Changes | Less than one hour | One day to one week | One week to one month | One to six months |
| Change Failure Rate | 0-5% | 0-15% | 16-45% | 46-60% |
| Mean Time to Restore | Less than one hour | Less than one day | One day to one week | More than one week |
The gap between Elite and Low isn't incremental — it's exponential. Elite teams deploy thousands of times more frequently with fewer than 1 in 20 deployments causing a problem. The question is: what separates them?
The Dashboard Trap
Most organizations install DORA tracking and stop there. They treat the metrics as outcomes to observe rather than signals to act on.
Here's what that looks like in practice:
The quarterly review. Engineering leadership reviews DORA numbers. Lead time went up. Someone suggests "improving code review speed." The team tries harder. Lead time doesn't change.
The gamification trap. A team targets deployment frequency. They start deploying smaller changes more often — but without changing how they work. They split one meaningful release into five meaningless ones. Deployment frequency goes up. Actual delivery stays the same.
The blame game. Change failure rate spikes. Management asks "Who's shipping broken code?" The answer is everyone — because the test suite doesn't catch regressions. But nobody asks why the tests don't catch regressions.
The problem isn't the metrics. The problem is treating them as the destination instead of the compass.
Why DORA Numbers Don't Move
DORA metrics are lagging indicators. They tell you what happened — your lead time is 14 days, your change failure rate is 23%. But they don't tell you why.
A lead time of 14 days could mean:
- Code reviews take too long (a process problem)
- Every change touches seven modules because of circular dependencies (an architecture problem)
- Manual QA is required because the test suite can't be trusted (a test effectiveness problem)
- Changes are large because the codebase doesn't support small, isolated changes (a structural problem)
Each cause requires a completely different intervention. Treating the symptom — "Let's speed up code reviews" — without diagnosing the cause is why DORA numbers don't move.
The Leading Indicators Most Teams Ignore
DORA metrics are lagging — they tell you what already happened. But there are leading indicators that move immediately when behaviors change. These are where day-to-day improvement actually lives:
- Integration Frequency — How often does each developer merge to trunk? Elite teams integrate multiple times per day per developer. If your team integrates less than once per day, changes are batching up, merge conflicts are growing, and lead time is inflating before code even hits the pipeline.
- Build Duration — How long does your pipeline take? The widely recognized threshold is 10 minutes. Longer builds break developer flow and set the floor for your minimum MTTR — you can't recover faster than your pipeline runs.
- Build Success Rate — What percentage of CI builds pass on first attempt? Below 70% means broken builds have been normalized. Above 90% means developers integrate with confidence.
- Work in Progress (WIP) — How many items are in-flight simultaneously? Little's Law is mathematical: cycle time = WIP ÷ throughput. Reducing WIP is often the fastest way to reduce lead time — no code changes required.
These leading indicators are the dials you turn daily. DORA metrics are the gauges that confirm the dials are working.
The Missing Connection: Code Health
DORA metrics measure delivery outcomes. Code health measures the conditions that produce those outcomes. The connection between them is the diagnostic layer most teams skip.
Consider two services in the same organization, same team, same tools:
| Metric | Service A | Service B |
|---|---|---|
| Health Score | 7.1 / 10 | 2.8 / 10 |
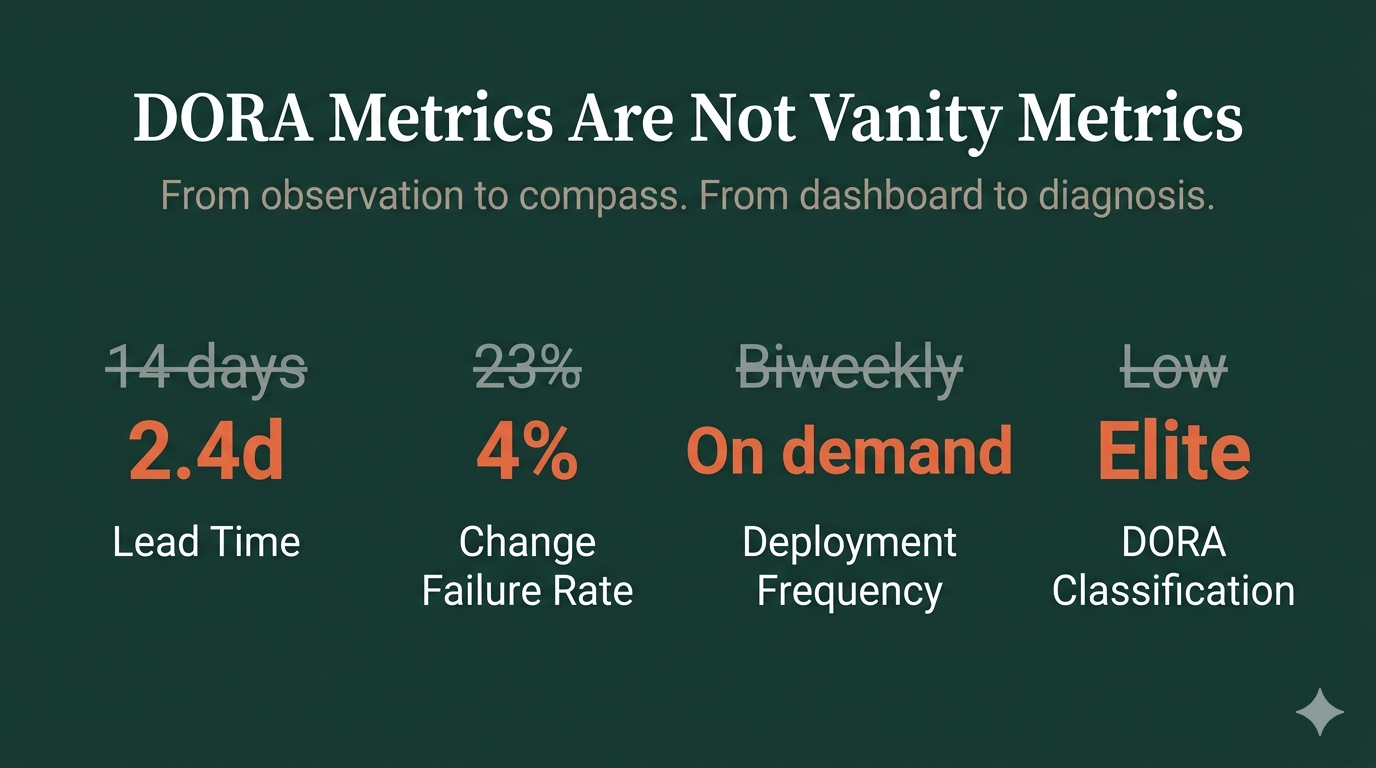
| Lead Time | 2.4 days | 17.3 days |
| Change Failure Rate | 6% | 38% |
| Deployment Frequency | On demand | Biweekly |
| Mutation Score | 78% | 9% |
| Architecture Violations | 12 | 2,847 |
Same developers. Same deployment pipeline. Completely different DORA numbers. The difference is the code underneath.
A critical caveat: this comparison is diagnostic, not evaluative. Comparing services to identify structural causes is useful. Comparing teams against each other on delivery metrics is an anti-pattern — it incentivizes gaming and optimization for the scoreboard rather than for actual capability. DORA metrics are for a team's own improvement trajectory, not for side-by-side rankings.
Service B's 17.3-day lead time isn't a process problem — it's a structural one. 2,847 architecture violations mean every change has a large blast radius. A mutation score of 9% means the test suite catches almost nothing, forcing manual verification. A health score of 2.8 means the codebase is expensive to change.
How Elite Teams Use DORA as a Compass
Elite teams don't just observe DORA — they connect each metric to the engineering practices that drive it. Here's how the compass works.
Deployment Frequency → Scope Enforcement
Elite teams deploy on demand because every change is small enough to ship independently. This isn't developer discipline — it's structural enforcement.
When a feature is planned, it gets broken into vertical slices — each independently shippable, each touching only the modules it needs. Scope thresholds enforce this: if a change exceeds the threshold, it gets split before work begins.
Small scope → small changes → fast reviews → frequent deploys. The DORA metric (Deployment Frequency) is the outcome of scope enforcement, not the goal.
Lead Time → Architecture Health
Lead time measures the time from commit to production. Most of that time isn't pipeline execution — it's the human work: understanding what to change, making the change safely, reviewing it, and verifying it.
Architecture health determines how long that human work takes. In a well-structured codebase, a change touches one module with clear boundaries. In a poorly structured one, the same change touches seven modules with tangled dependencies.
When architecture violations force large changes, developers spend more time navigating the codebase than building features. Code reviews take longer because the blast radius is larger. Integration is riskier because more is changing.
The compass: when lead time is high, look at architecture health. Specifically look at circular dependencies, coupling, and module boundaries. Fix the architecture, and lead time drops — not because developers worked faster, but because the work became structurally smaller.
Change Failure Rate → Test Effectiveness
Change failure rate measures the percentage of deployments that cause failures. Most teams respond by adding more QA, more manual testing, more review gates. This is treating the symptom.
The cause, overwhelmingly, is test effectiveness. Not coverage — effectiveness.
A team can have 90% code coverage and a mutation score of 11%. That means their tests execute 90% of the code but only verify 11% of the behavior. Those tests are decorative — they pass whether the code is correct or not. AI agents, manual QA, and new hires all trust these tests equally. And the failures keep shipping.
The compass: when change failure rate is high, run mutation testing on your critical paths. The mutation score will tell you how much of your test suite is actually protecting you.
Mean Time to Restore → Deployment Confidence
MTTR measures how quickly you recover from failures. Teams with slow MTTR usually have the same root cause: they can't deploy safely.
If deploying is risky — because changes are large, tests are weak, and rollbacks aren't automated — then recovering from a failure requires the same risky process that caused the failure. The team enters a spiral: failures make them cautious, caution makes deployments bigger, bigger deployments fail more often.
The compass: MTTR improves when deployment becomes routine. When changes are small, tests are effective, and the pipeline is fast, rolling forward or rolling back is a non-event. The DORA metric reflects deployment confidence, and confidence comes from engineering foundations.
Observing vs. Enforcing: The Structural Difference
Here's the gap between teams that track DORA and teams that achieve elite DORA: enforcement.
| Dimension | Observing | Enforcing |
|---|---|---|
| Scope | "Keep changes small" (guideline) | Scope thresholds block oversized changes before work starts |
| Architecture | "Follow the module boundaries" (wiki) | Dependency rules checked on every commit |
| Testing | "Write tests" (convention) | Quality gates require mutation score above threshold |
| Deployment | "Deploy when ready" (manual) | Pipeline deploys on every green merge to main |
Observation relies on developer discipline. Enforcement makes the right thing structural.
When scope thresholds are enforced at the plan phase, deployment frequency improves because every change is independently shippable. When architecture rules are checked on every commit, lead time improves because changes stay small and isolated. When quality gates require effective tests, change failure rate drops because bugs are caught before they ship.
The AI Acceleration Question
Every CTO is asking: "Can AI help us improve DORA metrics?"
The answer depends entirely on your codebase.
Teams with healthy codebases (health score 5.0+, strong architecture, effective tests) see dramatic improvements from AI agents. Changes that took days take hours. The agents have clear patterns to follow, effective tests to validate against, and architecture boundaries to work within.
Teams with unhealthy codebases see DORA metrics get worse with AI. The agents amplify existing anti-patterns at scale — generating code faster into broken architecture, shipping bugs faster through decorative tests, creating larger blast radius changes faster through tangled dependencies.
The compass: check your DORA metrics before and after AI adoption. If they're getting worse, the problem isn't the AI — it's the codebase the AI is working on. Fix the foundations first, then accelerate.
Building Your DORA Compass: A Framework
If your DORA metrics aren't improving, here's the diagnostic framework that connects metrics to causes:
Step 1: Measure what you have. Track all four DORA metrics at the service level, not the org level. Aggregate numbers hide the services that are dragging the averages down.
Step 2: Connect metrics to code health. For each service, measure architecture health, complexity, maintainability, and test effectiveness. The correlation between code health and DORA performance will reveal which services need attention — and why.
Step 3: Prioritize by DORA impact. Not all code health improvements are equal. A service with 2,800 architecture violations and a 17-day lead time gets more ROI from fixing circular dependencies than from improving naming conventions. Prioritize by projected DORA impact, not by severity of the violation.
Step 4: Fix, measure, repeat. After every intervention, re-measure both code health and DORA. The correlation should tighten — as health improves, delivery performance improves. If it doesn't, the intervention targeted the wrong cause.
Step 5: Enforce structurally. Once you know which practices drive DORA improvement, encode them as gates — not guidelines. Scope thresholds. Architecture checks. Quality gates. Automated deployment on green. The goal is to make elite DORA the structural default, not a heroic achievement.
The Bottom Line
DORA metrics become vanity metrics when they sit on a dashboard disconnected from the engineering decisions that drive them. They become a compass when connected to the code health dimensions that explain why the numbers are what they are.
The question isn't "What are our DORA metrics?" — most teams already know.
The question is "What about our codebase produces these DORA metrics, and what do we change to move them?"
That's the difference between observing performance and engineering it.

